What separates a fight read from a fighter opinion
The best UFC bet I ever placed was a flyweight underdog at 11/4. The worst was a heavyweight favourite at 1/3. Same year, same bankroll allocation. The flyweight pick came from forty minutes of measuring strike differentials and takedown defence percentages. The heavyweight pick came from “I just like him”. The data won. The vibe lost. That is the article in one sentence.
This is not a tipsheet or a “five hot picks” page. It is a methodology guide for reading UFC fights through measurable signals — the kind of read that lets you push back against your own gut when the gut is wrong. UFC favourites cash at around 68 percent over the long history of the promotion, and that number tightened to 72 percent across the 2024 sample. The 32 percent underdog rate from 2023 and 2024 is where the real money lives, but only if you have a way of identifying which underdogs are mispriced and which are correctly long. That way is data.
Across the next ten sections I will walk through the five fighter metrics I read on every card, how to use the favourite-underdog baseline, the way weight class shifts the entire model, what styles actually translate into edges, why reach is overrated and Octagon time is underrated, what 6.7 percent body mass loss actually does to a fighter, and where to find clean data without paywalls. The piece is not a tipsheet. It is a method.
The five fighter metrics I read on every card
If you ask me what I look at first when a UFC card drops, the answer is not “tape”. It is a spreadsheet with five columns. Tape comes later. The numbers decide where the tape is worth watching.
The first metric is SLpM — Significant Strikes Landed per Minute. This is the raw output number. A fighter at 5.5 SLpM is volume-heavy; a fighter at 2.8 SLpM is selective. Volume alone tells you very little, but combined with the second metric, it tells you a story. The fighter pace and the fight pace are not the same thing; SLpM tells you what the fighter wants the pace to be.
The second metric is Striking Accuracy — percentage of significant strikes that land. Anything above 50 percent is genuinely high. A fighter with 5.5 SLpM and 52 percent accuracy is connecting at a real rate. A fighter with 5.5 SLpM and 38 percent accuracy is throwing a lot of strikes that miss. The combination of high volume and low accuracy is often a sign of an aggressive fighter who can be exploited by patient counter-strikers.
The third metric is SApM — Significant Strikes Absorbed per Minute. A fighter at 3.5 SApM is getting hit a lot; a fighter at 1.8 SApM is hard to land on. Compare SLpM minus SApM to get the strike differential — the single best single-number indicator I know for who is winning the striking exchanges. Positive differentials over the last five fights generally translate into moneyline favourites.
The fourth metric is Striking Defence — percentage of opponent significant strikes that miss. A fighter with 65 percent defence is genuinely hard to hit; one with 48 percent defence is taking nearly every strike. Where this matters most is in matchups where both fighters have high accuracy — the defender’s number tells you which fighter is going to make the other look slow.
The fifth metric is takedown numbers — Takedown Average per 15 minutes, Takedown Accuracy, and Takedown Defence. I treat these as a cluster because they tell one story about whether a fight will be contested on the feet or on the mat. A grappler at 3.2 takedowns per 15 minutes with 45 percent accuracy against a striker at 60 percent takedown defence is a fight that will mostly happen standing. Reverse those numbers and you have a fight that lives on the canvas.
The trap with these five metrics is treating them as independent. They are not. A wrestler with a low SLpM is not “less of a striker” — they are a different kind of fighter who scores points elsewhere. Always read the five numbers together, against the opponent’s mirrored numbers, and against the divisional baseline.
The favourite-underdog baseline and why backing chalk does not work
A reader once sent me a spreadsheet showing he had backed every UFC main-event favourite for a year. His win rate was 71 percent. His return on investment was minus 8 percent. He could not understand why a winning percentage above 70 had cost him money. The answer is in the gap between win rate and break-even rate, and it is the most important single concept in UFC betting.
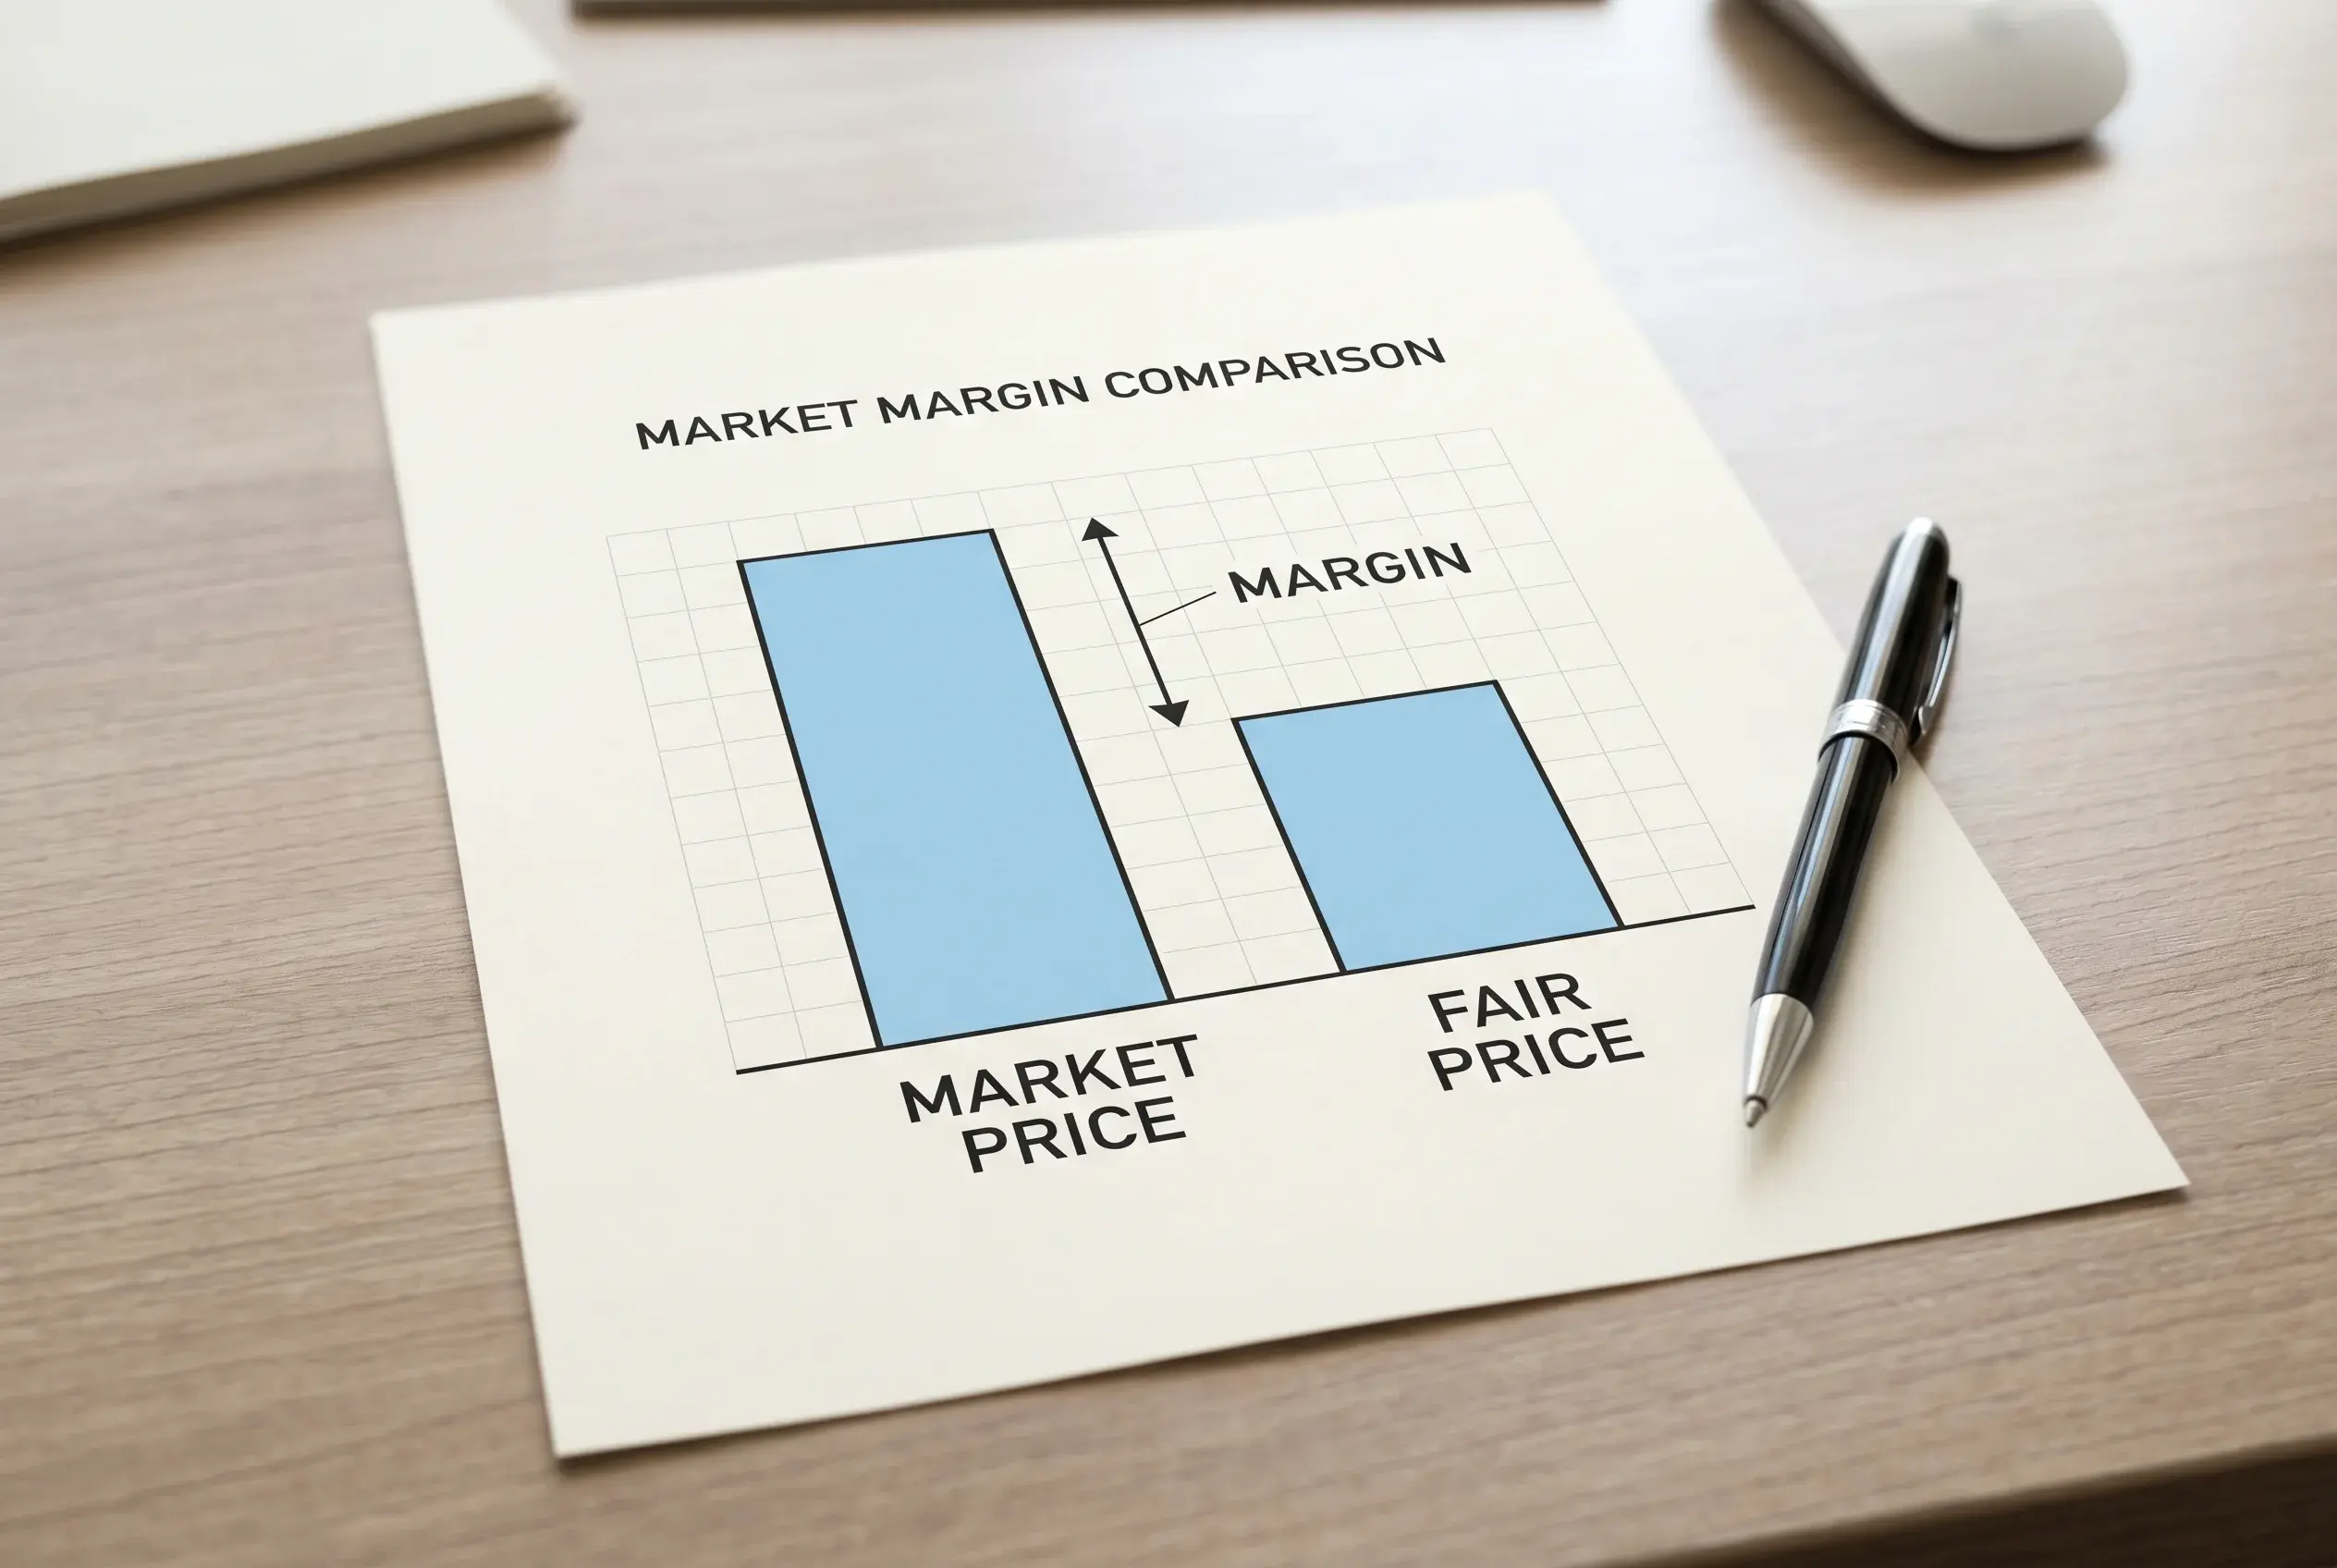
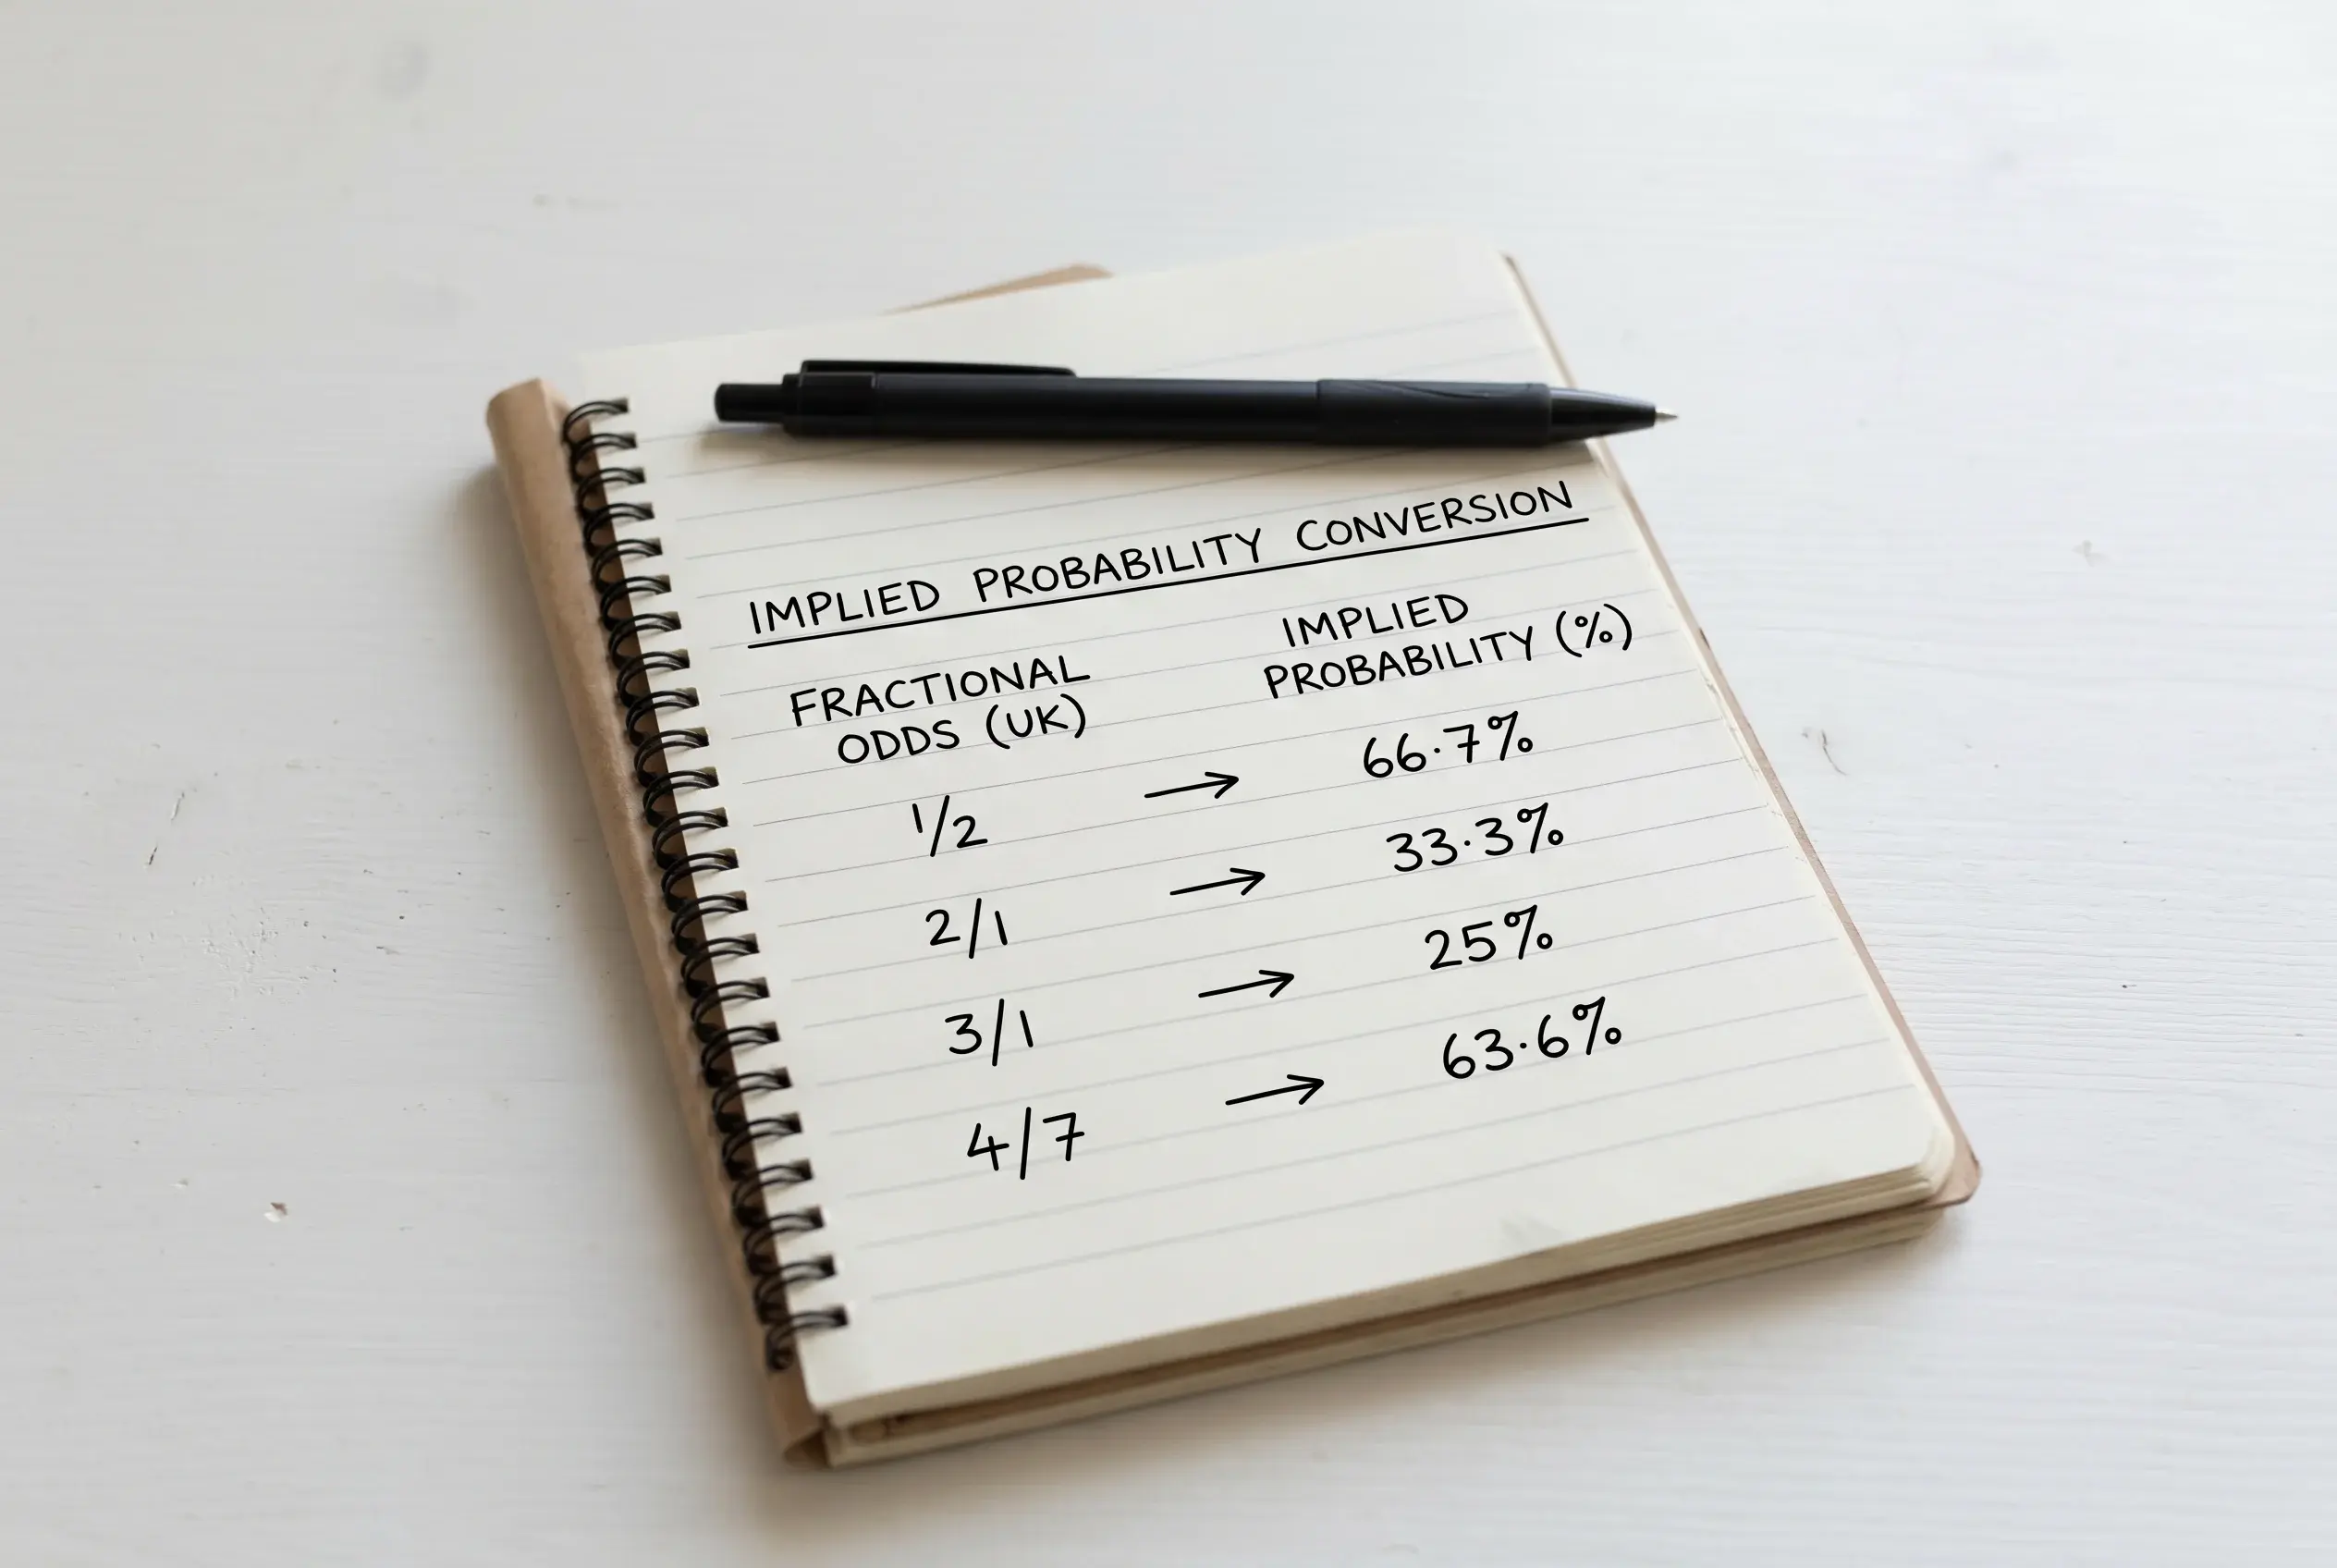
The long-run baseline says UFC favourites win about 68 percent of fights. In the 2024 sample, the figure was closer to 72 percent. UFC underdogs win the remaining 28 to 32 percent. Those numbers are real and stable enough to anchor a model around. But “win rate” is not “profit rate”. A fighter priced at 1/3 has an implied probability of 75 percent. If they win 72 percent of the time, you lose money backing them at that price.
The same logic flips on underdogs. A fighter priced at 3/1 has an implied probability of 25 percent. If a class of underdogs at that price range cashes 32 percent of the time, backing every underdog at 3/1 or longer is profitable in the long run, before margin. After margin and operator restrictions, the edge gets smaller but it does not vanish.
Underdog champions tell a related story. Of 19 UFC underdog champions in history, 12 retained their belt — a 63 percent retention rate. That is significantly higher than the random base rate would suggest. When an underdog upsets a champion, the upset is rarely a fluke; it is usually a stylistic or generational shift that the market underestimated. The same fighter, freshly champion, often defends successfully because the market took several fights to catch up to their actual level.
The practical method I use: filter the card for favourites priced above their long-run win rate (sub-30 percent implied probability fighters facing odds-on opponents). Then check the underdog metrics — strike differential, takedown defence, recent form — to see whether the price reflects reality or whether the market has overshot. The bets I actually place are a small fraction of the card. The bets I notice and decline are the discipline.
One trap to flag. The favourite-underdog baseline shifts over time. The 2024 figure of 72 percent for favourites was elevated relative to the long-run 68 percent — partly because the trader pool got more sophisticated, partly because the elite layer of UFC has compressed as the promotion expanded. If you anchor a model on the long-run number, you may be selling favourites too cheaply against the current market. Re-baseline annually.
Why weight class changes everything about the read
A friend who bets only flyweight and bantamweight asked me last year if his strategy was unusual. It was. Most punters drift toward heavyweight and lightweight because the names are bigger and the highlight reels louder. The funny thing is, his approach was statistically more defensible than mine for years was.
The flyweight division has produced some of the cleanest favourite patterns in UFC history. Since 2020, men’s flyweight favourites have posted a 30-8-1 record — a 77 percent winning rate, significantly above the divisional average. That is not random. Flyweight is technically demanding, the elite are deeply technical, and the margin between top-five and everyone else is narrower than in other divisions but more decisively expressed in cage outcomes. Backing flyweight favourites at fair prices has, for years, been a reliable strategy — though the market has caught up and the prices have shortened.
Heavyweight runs in the opposite direction. The division is volatile because one clean shot ends most heavyweight fights. Favourites win less reliably and the average underdog price is shorter, because the operator’s trader hedges against the volatility. A heavyweight underdog at 5/2 is a more realistic bet than a flyweight underdog at 5/2 — not because the fighter is closer in ability, but because the punch that ends the fight does not care about ability gaps.
Mid-weight divisions — lightweight, welterweight, middleweight — sit between the two extremes. Favourites win at rates close to the long-run baseline. Underdogs cash often enough to be playable. These are the divisions where reading the five metrics actually rewards effort the most, because the priced and the actual probability are closest, and small reads tip the balance.
Women’s divisions follow a slightly different pattern. The sample size is smaller — fewer fights, fewer fighters — and the talent pool depth varies by division. Women’s bantamweight has historically been deep and unpredictable; women’s strawweight has been dominated by a small group of elite fighters. The standard divisional baseline does not transfer cleanly. If you bet women’s divisions, build separate baselines for each.
The practical takeaway. Before reading any individual fight, know the divisional baseline. A 65 percent favourite in flyweight is closer to a 75 percent real probability of winning; a 65 percent favourite in heavyweight is closer to a 60 percent real probability. The numbers on the slip lie about the same amount in opposite directions across divisions, and adjusting for that is most of the value you will extract from data-driven UFC betting.
Style matchups — the stories the data tells
The classic question — “does a grappler beat a striker?” — is the wrong question. The real question is “does this specific grappler beat this specific striker, given the cage geometry, the gas tank, and the takedown defence numbers?” And the data on the broad style buckets actually answers a different question to the one most punters think they are asking.
Across the long history of UFC, fighters classified primarily as wrestlers have outperformed fighters classified primarily as strikers slightly more often than the moneyline would suggest. The underlying mechanic is takedown completion. A wrestler who lands their takedown wins more often than a striker who lands their counter, because the takedown leads to more cage time on top, more decision-favourable optics, and more genuine finish opportunities. The takedown is the leverage point.
Pure BJJ specialists against pure wrestlers tell a more interesting story. The pure submission grappler has historically struggled against the elite wrestler, because the wrestler controls where the fight goes and can avoid bad positions. A BJJ specialist with weak wrestling defence is, statistically, a fade against a strong wrestler — even when the betting market shows their submission threat as a major edge.
The southpaw-orthodox question gets a lot of attention and probably deserves less than it gets. There is a small statistical advantage for southpaws in striking exchanges against orthodox opponents, attributable to the lead-leg geometry and the rear-power-hand reach. The effect size in UFC samples is real but small — maybe 2 to 3 percentage points on a fighter’s expected striking output. Worth noting when other factors are close; not worth betting on alone.
Pressure fighters against counter-strikers is the matchup that breaks line predictions most reliably. A pressure fighter — high SLpM, willing to absorb strikes — against a defensive counter-striker often produces fights that look statistically unsurprising but feel one-sided live. The pressure fighter wins by accumulation; the counter-striker scores cleaner shots but fewer of them. Decision-favourable on the cards, frustrating for the counter-striker’s betting public.
What this means for Method of Victory betting: style tells you finish probability more directly than win probability. A grappler-striker matchup tilts toward decision because the grappler wants positional control. A striker-striker matchup tilts toward KO. Read the styles, then bet the method.
Reach, age and Octagon time — three signals, one of them overrated
Reach is the metric every commentator mentions and every casual punter overweights. Two inches of reach difference does not decide a UFC fight unless both fighters are equally skilled, equally fast, and equally willing to use the longer arm — and in that scenario, the fight is close enough that other factors dominate anyway. The real reach effect kicks in when the differential exceeds five inches and is paired with a fighter who actually fights long. Most reach gaps in UFC are 2 to 4 inches and have negligible predictive power on outcomes.
Age curves are a different story. UFC fighters tend to peak between 28 and 32 across most divisions. Heavyweights can peak later because the division is less reliant on speed; women’s strawweight and flyweight tend to peak earlier because the division has fewer veterans to displace. A 36-year-old fighter is not necessarily declining, but the prior is that they should be. Recent form against younger opposition is the test — a 36-year-old beating 28-year-olds is still competitive; a 36-year-old losing to 30-year-olds is finished.
Octagon time is the most underrated experience metric. Fight count tells you how many fights a fighter has had. Octagon time tells you how many minutes they have actually spent in real combat. Tom Aspinall, the UFC heavyweight champion, holds the record for the shortest average fight time in UFC history — two minutes and eighteen seconds. That means his Octagon time per fight is lower than almost any other heavyweight, despite his record being decorated. His ability to finish quickly is a strength on the moneyline; it is also a structural quirk in his data — his sample of real-time decision-making under exhaustion is smaller than his win count suggests.
The implication for betting reads. Use fight count as a quick proxy for experience but verify Octagon time when the fighter is involved in a high-stakes bout. A wrestler with 18 UFC fights and 90 minutes of Octagon time has been in trouble and survived. A striker with 18 UFC fights and 35 minutes of Octagon time is either dominant or untested — the data does not distinguish, and you need tape to know which.
Combining the three signals: reach is a tiebreaker, age is a prior, Octagon time is the depth of experience. None of them on its own predicts a fight. Together they form one corner of a fighter’s profile that, combined with the five strike-and-grappling metrics, gives you a complete read.
The weight cut — what 6.7 percent of body mass actually does
Deiveson Figueiredo, after losing the flyweight title in 2022, told an interviewer plainly that the weight cut was the thing — that he did not have a healthy weight cut, that it was really hard to beat the weight, that he left the hotel feeling very bad, and that he knew it was not his day. The candour from a former champion is rare and it is the cleanest description I have heard of what a bad cut does to a fighter’s chances.
The physiology behind that admission is documented. A peer-reviewed study tracked UFC athletes through the cut process and found that fighters lose, on average, 6.7 percent of total body mass in the 72 hours before the weigh-in. They regain approximately 9.7 percent of body mass in the 24 to 36 hours after the weigh-in. The cycle involves significant dehydration, glycogen depletion and electrolyte disruption — and even with elite-level rehydration protocols, the residual effects on power output, reaction time and cardiovascular endurance persist into fight night.
For betting purposes, that means a few things. First, weigh-in misses are a real signal of trouble. A fighter who misses weight had a worse cut than planned, and worse cuts correlate with worse fight performances. If you have a moneyline bet on a fighter who misses weight by more than a pound, expect line movement against you and consider whether the operator’s grading rules let you out of the bet. Most UK books will void a missed-weight bet if the bout proceeds at catchweight only at the customer’s option; some void automatically. Read the rules.
Second, repeat weight missers should be permanent fade material. A fighter who misses weight on multiple occasions has either body composition issues, discipline issues, or both. Either way, their performance is unreliable and the market often underprices the historical pattern because each individual fight is treated as a fresh case. The pattern is the signal.
Third, the cut affects Round 1 finish rates. A fighter coming off a hard cut is most dangerous in the first round — energy reserves are highest, adrenaline masks the depletion. If the fight goes deep, the cut shows. Bet builders that combine “Fighter A by KO” with “in Round 1” gain extra correlation when one fighter has a documented bad-cut history.
The deeper mechanics of how cuts affect specific betting markets I cover in the UFC weight cut betting impact guide. For the read-the-fight purposes of this article, the rule is simple: when a cut is in the news, expect the cutter to underperform, and bet accordingly.
Short-notice fighters — fade or buy?
Short-notice fights happen multiple times per UFC card and they break almost every read in the playbook. A replacement fighter typically takes the bout with two weeks of preparation or less, which means no camp focus on the specific opponent, an accelerated weight cut, and a fighter whose conditioning baseline depends entirely on what they were doing before the call came.
The data on short-notice replacements is messy because the sample is small and noisy. As a rough rule, short-notice replacements win below the rate the betting market prices them at. They are often priced as moderate underdogs when the public sees them stepping up bravely; the market frequently overvalues the “story” element. The boring truth is that two weeks of preparation against a fully-camped opponent is a real disadvantage.
Two situations where short-notice replacements outperform their price. First, when the replacement was already deep in camp for a different fight at the same weight class — they took an opportunity that fits their existing preparation. Second, when the original opponent’s withdrawal followed a leak that suggested the original fighter was unprepared — the replacement is stepping into a fight that the favourite was never going to handle as well as the price suggested.
The weight-cut question is acute for short-notice replacements. A fighter accepting a bout on five days’ notice has to cut weight without the gradual preparation period a normal camp provides. The 6.7 percent body mass loss in 72 hours that fighters experience under normal cut conditions can be exceeded under rushed conditions, with all the performance penalties amplified.
Method of Victory and round betting on short-notice replacements becomes very high-variance. The replacement might gas in Round 2 and lose by TKO; they might catch a single strike in Round 1 and steal the fight. Their range of plausible outcomes is wider than a fully-camped fighter’s. Fade the granular markets on short-notice replacements and stick to moneyline where the operator’s overround is tightest.
Where to find clean UFC data without paywalls
I get asked the source question more than any other. The honest answer is that the cleanest UFC fighter data lives on the official UFC Stats site and on Sherdog, both of which are free and both of which have been the foundation of every serious MMA analyst’s workflow for over a decade.
UFC Stats publishes Significant Strikes Landed per Minute, Striking Accuracy, Strikes Absorbed per Minute, Striking Defence, Takedown Average, Takedown Accuracy and Takedown Defence on every active fighter’s profile. The granularity goes deeper than most casual analysis uses — split per fight, per position (distance, clinch, ground), per body target. For pre-fight reads, the headline numbers are usually sufficient. For deeper work, the per-position breakdown reveals where a fighter actually scores their strikes.
Sherdog provides comprehensive fight records, opponents, methods of victory and round-by-round history. The site has been catalogued since the 1990s and includes pre-UFC fights for fighters who came up through other organisations. Useful when assessing an incoming UFC fighter whose body of work pre-dates the promotion.
Tapology fills the gaps — event pages with venues, attendance and revenue numbers, fight-by-fight betting odds histories where available, and aggregated fighter statistics that complement UFC Stats with a different cut.
Beyond the three obvious sources, a handful of analyst-run sites publish weekly UFC stats deep-dives free of charge. They are worth following on social media for fight-week breakdowns. Paid services exist — predictive models, line-comparison tools, advanced metrics — but for a UK reader betting recreationally a few times a month, the free sources are sufficient.
One warning. AI-generated UFC analysis pieces have proliferated since 2023. Many of them quote numbers that look authoritative but cannot be cross-checked against UFC Stats. If a stat seems too clean and you cannot find it on the primary source, the stat is probably fabricated.
Case study — what Aspinall’s record actually means for a betting model
Tom Aspinall has been the cleanest data case study in UFC heavyweight in years, and his record is a useful test of how the methodology I have laid out actually applies to a real fighter. The headline number is that 2:18 average fight time — the shortest in UFC history among ranked heavyweights. His finishing rate is exceptional. His Octagon time is, by extension, low for his fight count.
What does that mean for betting his fights? Several things. First, his moneyline price is usually short because the market sees the finishing rate clearly. The value, when it exists, is not on the moneyline. Second, his Round 1 finish lines are usually short for the same reason — the market knows. Third, his Performance of the Night prop is usually priced as a near-favourite to win the bonus, because a heavyweight who finishes early is a Performance of the Night magnet.
The interesting markets are the ones that exist because of his short Octagon time. If a fight does go past Round 1 — which has happened twice in his UFC career going into 2026 — his behaviour in extended fights is undertested. The Total Rounds Over markets on Aspinall fights are typically priced very long, reflecting market consensus that he will not allow them to develop. When the fight gets to Round 2, his data baseline thins out. A patient opponent who survives Round 1 is fighting a slightly different Aspinall — one with less in-cage decision-making sample size than his win count suggests.
After finally securing the undisputed heavyweight title in late 2025, Aspinall described the moment in his own words — that he had always cared about the heavyweight title, that recognition for being the best heavyweight on the planet was what he had been bothered about, and that he was relieved he could just fight again. The relief there is the data point I find most useful. A fighter whose primary motivation is settled — the title is his — has a different psychological profile to a fighter chasing the belt. Defensive champions, fighters whose primary motivation has shifted from acquisition to defence, sometimes underperform their pre-title baseline. Whether Aspinall does that is the next betting question for his fights through 2026.
The wider lesson from his case is that even the cleanest data tells a partial story. The metrics tell you what has happened; they tell you less about what will happen when the conditions shift. Use the data to anchor your read, then ask what is different about the next fight. The intersection of “what the numbers say” and “what is structurally different this time” is where the betting edge lives.
Frequently asked questions about data-driven UFC betting
The questions below are the ones that come up most when readers ask me how to apply data to UFC fights. The answers reflect what I do in my own betting, not what every analyst would do.