
Misleading UFC Statistics vs Predictive Fighter Metrics
For my first year betting UFC seriously, I weighted significant strikes landed per minute as the dominant predictive statistic. The logic felt airtight – a fighter landing more strikes is presumably winning more exchanges and accumulating damage, which translates into rounds won and fights won. I’d plug both fighters’ rates into a mental model, weight the difference, and feel confident I’d found an edge. Beyond standard striking metrics, analyzing a southpaw vs orthodox stance matchup can reveal hidden advantages inside the octagon.
The first year of doing that produced one of the most uneven betting records I’ve kept. The high strike-rate fighter won often enough to keep the system feeling right but lost frequently enough on big underdog plays to leave me net down. The lesson was that strikes-per-minute is a statistic that describes what a fighter does, not what they accomplish – and the gap between the two is where most fighter-statistics betting goes wrong.
What fighter statistics actually measure
UFC fighter statistics are a record of observed events during fights. Significant strikes landed, takedowns attempted, control time, knockdowns scored – every number on a UFC stat sheet is a count of something that happened in past fights. The numbers are accurate. What they’re not is automatically predictive.
The conceptual leap that’s required is from “what this fighter did against past opponents” to “what this fighter will do against this specific opponent”. Past stats reflect the average outcome across a range of opponents with varying styles. A current matchup is a specific opponent with a specific style, and the historical average may or may not apply.
The clearest example is wrestlers facing strikers versus wrestlers facing other wrestlers. A wrestler with a career takedown rate of 4 takedowns per 15 minutes against a varied range of opponents will not maintain that rate against another high-level wrestler who specialises in takedown defence. The 4 per 15 is the historical average; the current matchup might produce 1 takedown or 0. The headline statistic suggests one thing; the matchup-specific reality is something else.
This isn’t a critique of statistics. It’s the recognition that statistics need to be read in context – the opponent context, the cardio context, the weight cut context, the recent activity context. The raw numbers are inputs to a thought process, not outputs of one.
The four statistics that actually predict reliably
Some UFC statistics carry signal that survives the contextual translation problem. The first is significant strikes absorbed per minute. A fighter who absorbs strikes at a low rate has demonstrated defensive ability across a range of opponents – head movement, footwork, range management, or some combination – that generalises better than offensive rate. The defensive metric is less style-dependent than the offensive metric.
The second is takedown defence percentage on attempts above a meaningful sample size. A fighter who’s defended 90%+ of takedown attempts across 30+ attempts has demonstrated genuine wrestling ability. The skill doesn’t fully transfer against elite wrestlers – no statistic survives that level of style mismatch perfectly – but it transfers more reliably than offensive volume metrics.
The third is control time as a percentage of fight time. Control reflects positional dominance, which correlates with damage delivery and judges’ scoring. A fighter consistently controlling 40%+ of their fight time at the championship level is doing something repeatable. The metric is one of the more reliable predictors of decision outcomes specifically.
The fourth is finish rate against ranked opposition, separated from finish rate against unranked opposition. The aggregated career finish rate often hides the structure – a fighter with 75% finishes against unranked opponents but 20% against ranked opposition is materially different from a fighter with 50% finishes across both groups. The split-out version is the one that predicts.
The statistics that are mostly noise
Strikes thrown per minute. Volume of strikes thrown reflects style preferences as much as fight effectiveness. A pressure fighter throws high volume because they’re forcing the pace; a counter-striker throws lower volume because they’re conserving for openings. Neither volume figure tells you who wins the matchup.
Striking accuracy percentage. The percentage is mathematically clean but operationally noisy. A fighter with 50% accuracy against opponents who stood in the pocket might drop to 35% against an opponent who pulls back. Accuracy is a function of opponent style at least as much as the fighter’s own skill.
Submission attempts per 15 minutes. The attempt rate captures willingness to engage in grappling exchanges, not effectiveness at finishing them. A fighter who attempts 3 submissions per 15 minutes but lands fewer than 1 in 10 is going to underperform their attempt rate against any opponent who survives a single early scramble.
Win/loss record absent context. A fighter with an 18-2 record against a mixed slate is not obviously better than a 12-4 fighter who’s faced only top-15 opposition. Records are operator-summary statistics, useful for narrative purposes but rarely predictive when comparing fighters at similar levels.
The recency weighting problem
The other dimension of statistical reading is when the statistics were generated. A fighter’s career-average takedown rate includes fights from five years ago when they were 25 years old, against opponents who are no longer active. The same statistic across the last six fights is potentially more relevant – and is also a much smaller sample.
The trade-off between sample size and recency is genuine and unresolvable in the abstract. Bigger samples are more statistically reliable but include outdated information. Smaller recent samples are more current but more noisy. The framing I use is to look at career-average and recent-six numbers side by side, and flag fighters where the recent number diverges meaningfully from the career number.
A fighter whose recent six-fight strike accuracy is 38% against a career average of 45% is showing a possible decline. A fighter whose recent takedown defence is 65% against a career 78% is potentially compromised – either by a specific run of strong wrestling opponents, or by an actual deterioration in defensive wrestling. Either way, the divergence is the data point worth investigating before betting.
The weight class context that changes everything
Statistics don’t translate cleanly across weight classes. Heavyweight fight statistics show much higher finish rates and lower decision frequencies than flyweight statistics. Tom Aspinall’s heavyweight record includes an average fight time of 2:18 – a number that would be incoherent in any non-heavyweight context. The same statistical profile applied to a featherweight would be unbelievable.
This matters for betting because the same statistical line means different things in different weight classes. A 60% takedown defence rate is poor at lightweight, mediocre at middleweight, and reasonable at heavyweight. Reading the percentage without the weight-class context produces consistent mis-calibration of fighter quality.
The specific number that’s worth tracking is flyweight favourites’ performance since 2020: a 30-8-1 record translating to a 77% win rate. The number is well above the historical UFC average of 68.12% for favourites generally, and reflects the weight class’s structural tendency toward technical decisions where the more skilled fighter prevails more often than in higher weight classes where one-shot KOs can flip outcomes regardless of skill differential. Statistics that include this kind of weight-class-specific signal are the ones to weight in pricing fights.
How statistics intersect with the operator’s model
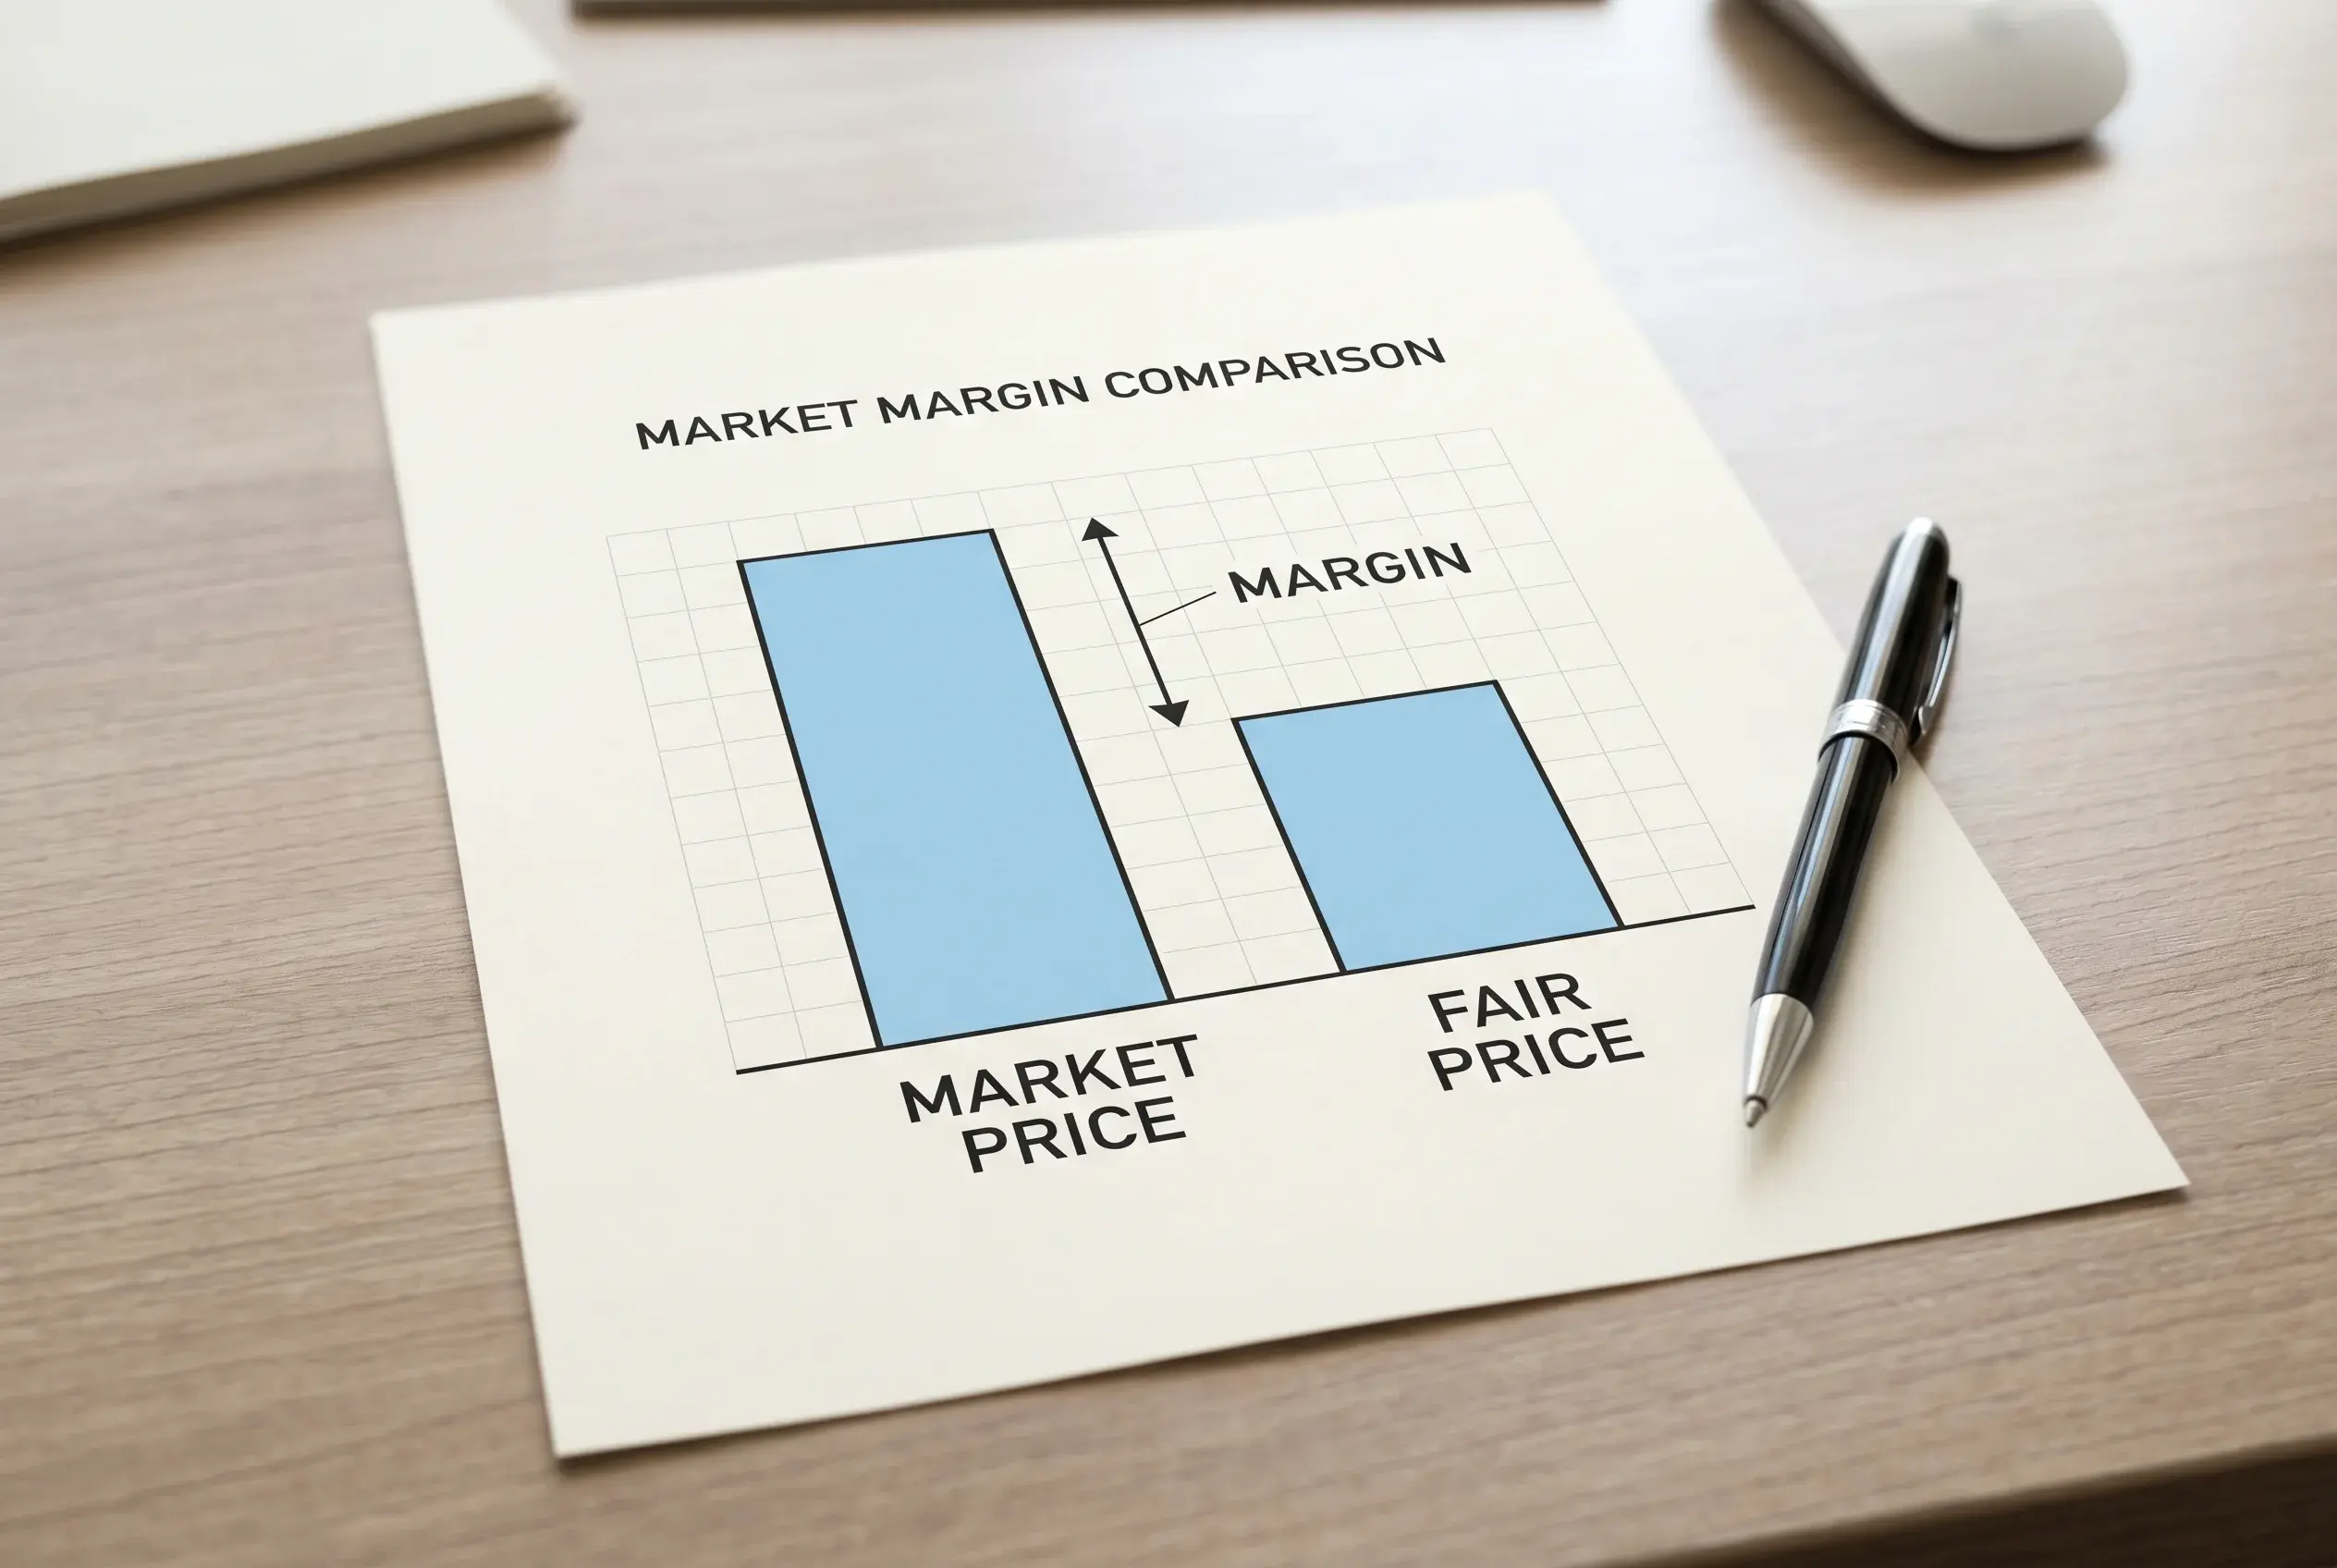
UK operator pricing models incorporate fighter statistics, but the weighting varies by operator and by market. The headline volume metrics – strikes per minute, takedowns per 15 – are typically heavily weighted because they’re the metrics that move betting volume and need to align with bettor expectations.
The metrics that are less heavily weighted in operator models are the ones with more predictive signal – late-round differentials, reversal rates, ranked-opposition splits. The gap between what’s weighted in operator pricing and what’s actually predictive is part of where bettor edge comes from. When your private assessment of a fight differs from the operator’s pricing because you’ve weighted a late-round differential the model is underweighting, the gap is the bet.
The caveat is that operator models do improve over time, and the metrics that are underweighted today may be more heavily weighted in eighteen months. The specific bets that worked in 2022 because operators underpriced wrestling-specific defensive metrics don’t work as reliably in 2026 because the models have integrated those metrics. The bettor’s job is to track which metrics remain underweighted in current pricing, which is a moving target.
What to actually do with all this
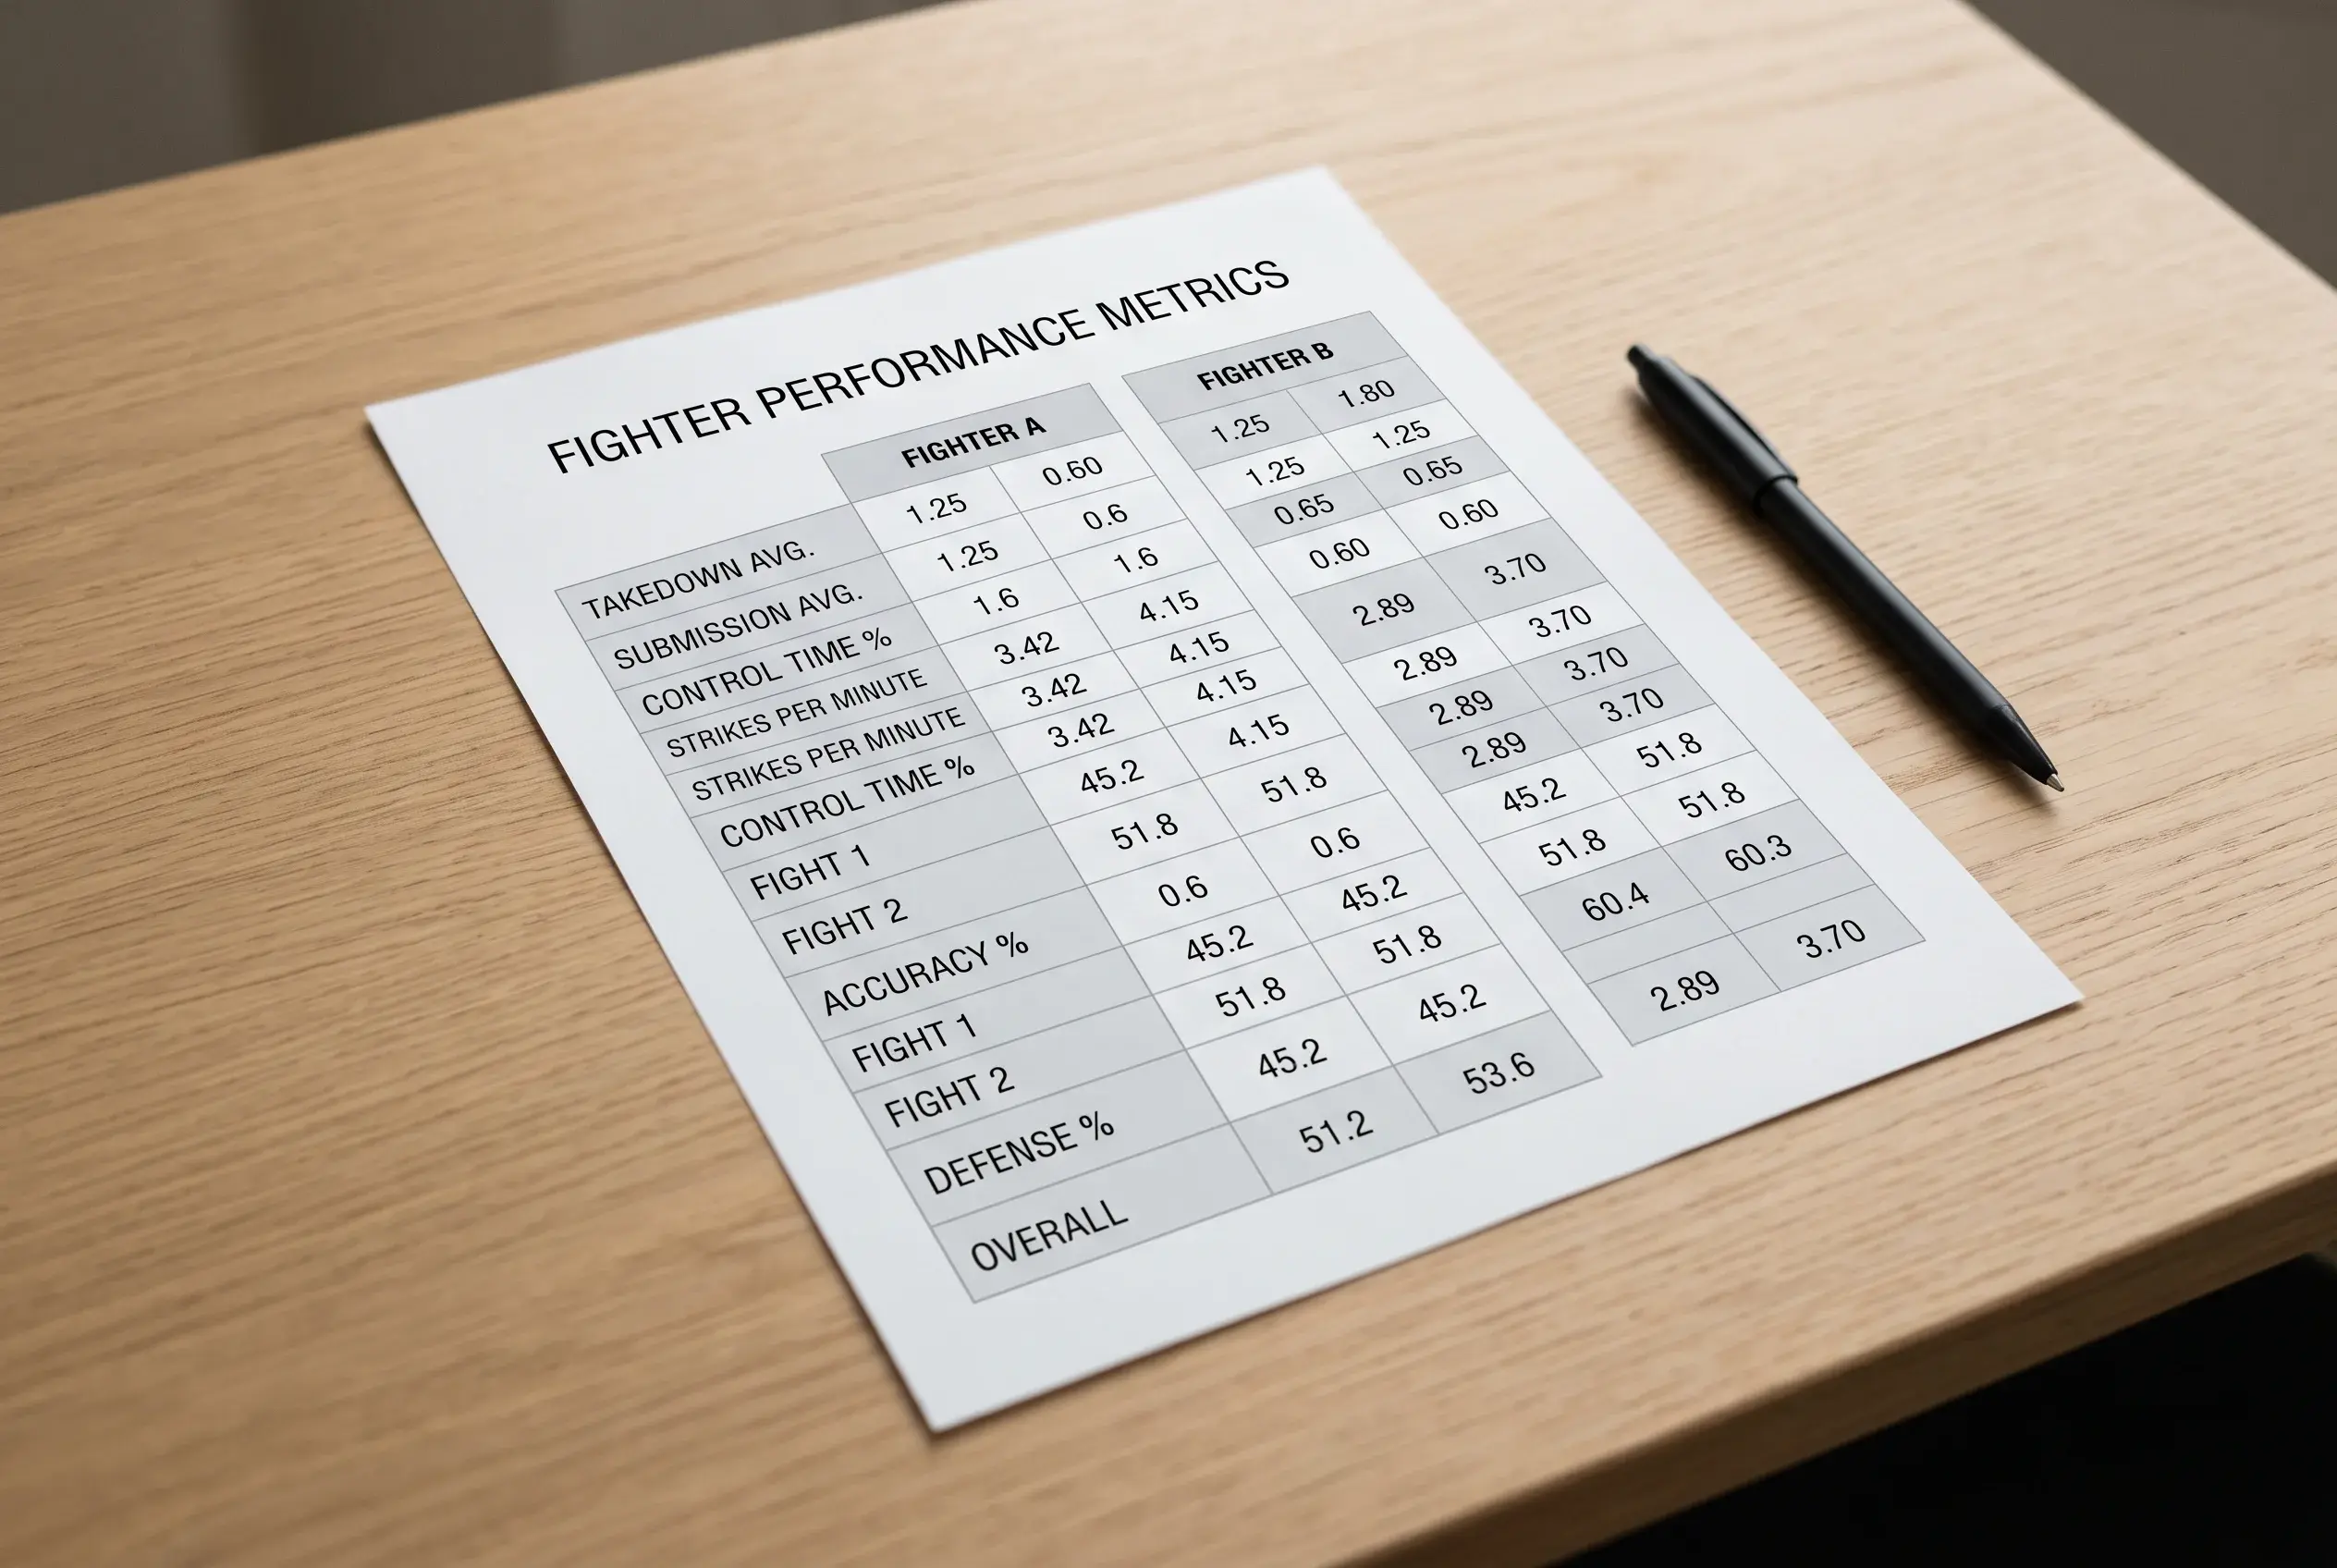
The practical application is a two-pass read on every fight. First pass: look at the publicly-promoted headline statistics – strikes per minute, takedown rate, win record – and check that the operator’s price roughly aligns with what those numbers would suggest. Almost always it will, because the same statistics drive the operator’s model.
Second pass: look at the less-promoted statistics – late-round differentials, ranked-opposition splits, reversal rates, recency divergences – and check whether any of them suggest a different read on the matchup than the headline statistics would. If the second-pass read meaningfully differs from the first-pass read, the operator’s price is likely under-reflecting that information, and the bet is on the side the second-pass read favours.
If both reads agree with the operator’s price, there’s probably no edge in betting that fight. The discipline is recognising that “no edge” is the correct conclusion in the majority of fights you analyse. Passing on fights where you don’t see a gap is as much a skill as identifying the gaps where they exist. One specific source of those gaps that deserves its own treatment is the impact of cutting and rehydrating to weight – how UFC weight cuts shape betting outcomes is a layer the headline stats almost never capture. Stay updated with the latest analytical breakdowns on our premier MMA betting website.